

Sampling Data techniques in a Stream – Data sampling is a statistical technique where a subset (sample) is selected from a larger dataset (population) for analysis. The goal is to study the characteristics of the sample and generalize findings to the entire population. Data sampling is widely used in areas like market research, machine learning, data analysis, and quality control.
For example, instead of analyzing customer data for a million users, a company may sample 10,000 users to draw meaningful insights.
Sampling Data techniques in a Stream

Types of Data Sampling | Sampling Data techniques in a Stream
Data sampling methods can be broadly classified into probability sampling (where every data point has a chance of selection) and non-probability sampling (where selection is not random). Below are the main types:
1. Probability Sampling
- Random Sampling
- Every member of the population has an equal chance of being selected.
- Example: Drawing 50 students randomly from a college of 2000 students.
- Advantage: Reduces bias; ensures representation.
- Disadvantage: Can be difficult with large datasets.
- Systematic Sampling
- Selects every ‘kth’ element in a population list.
- Example: Choosing every 10th person in a voter list.
- Advantage: Easy to implement and evenly distributes the sample.
- Disadvantage: Can introduce bias if the population has a repeating pattern.
- Stratified Sampling
- Divides the population into subgroups (strata) and samples proportionally from each.
- Example: Dividing employees into departments and sampling from each.
- Advantage: Ensures representation across key subgroups.
- Disadvantage: Complex to divide and organize the population.
- Cluster Sampling
- Divides the population into clusters and selects entire clusters randomly.
- Example: Selecting entire schools from a district for a survey.
- Advantage: Cost-effective for large, dispersed populations.
- Disadvantage: Less precise compared to random or stratified sampling.
2. Non-Probability Sampling
- Convenience Sampling
- Samples are chosen based on accessibility and ease.
- Example: Interviewing people at a nearby café.
- Advantage: Quick and inexpensive.
- Disadvantage: High risk of bias; may not represent the population.
- Quota Sampling
- Selects a sample to meet specific quotas, like age or gender proportions.
- Example: Ensuring 40% males and 60% females in a survey sample.
- Advantage: Simple to execute.
- Disadvantage: Lacks randomness, leading to potential bias.
- Judgmental (Purposive) Sampling
- Relies on the researcher’s judgment to select participants.
- Example: Choosing experts in a specific field for a study.
- Advantage: Focused on specific groups or insights.
- Disadvantage: Prone to researcher bias.
- Snowball Sampling
- Participants recruit other participants.
- Example: Studying hidden populations like drug users or freelancers.
- Advantage: Useful for reaching hard-to-access groups.
- Disadvantage: May lead to unrepresentative samples.
Importance of Data Sampling | Sampling Data techniques in a Stream
- Cost Efficiency: Sampling minimizes the expense of collecting and analyzing large datasets.
- Time-Saving: Allows quicker decision-making by focusing on a smaller subset.
- Practicality: Makes it feasible to work with enormous datasets that are otherwise computationally intensive.
- Generalizability: A representative sample ensures that conclusions apply to the broader population.
- Accuracy: When done correctly, sampling avoids biases and yields reliable results.
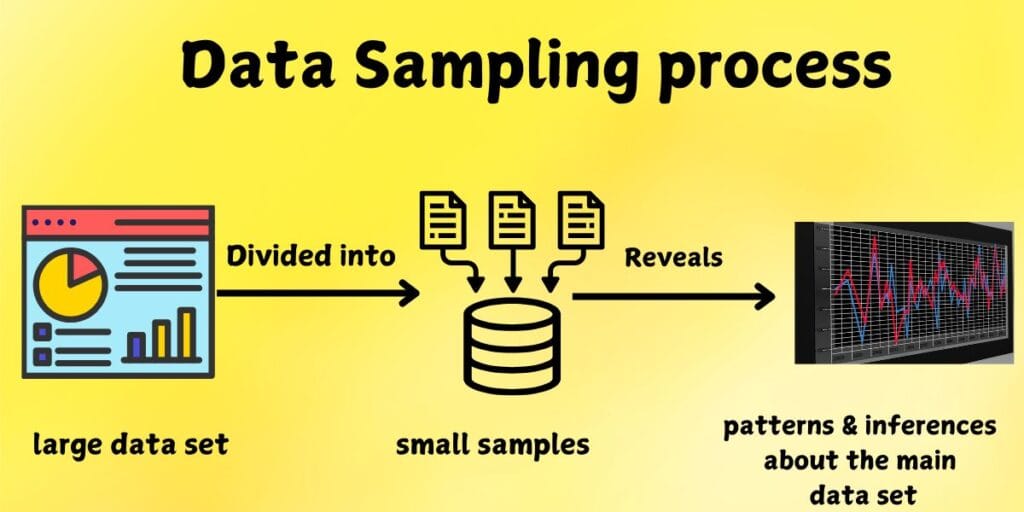
Process of Data Sampling – Sampling Data techniques in a Stream
The data sampling process includes several steps to ensure a valid and reliable sample:
- Define the Objective
- Identify the purpose of sampling.
- Example: Analyzing customer behavior for a product.
- Define the Population
- Clearly specify the group to be studied.
- Example: All customers who made a purchase in the last year.
- Choose the Sampling Method
- Select the technique based on population size, diversity, and study goals.
- Example: Use stratified sampling for a diverse population.
- Determine the Sample Size
- Calculate an appropriate sample size to ensure statistical significance.
- Tools: Use formulas or tools like Slovin’s formula for this calculation.
- Collect the Sample
- Execute the sampling method to collect the subset.
- Example: Distribute surveys or extract random rows from a dataset.
- Validate the Sample
- Check if the sample accurately represents the population.
- Example: Ensure diversity in age, gender, or location for a survey.
Advantages of Data Sampling
- Reduces Complexity: Simplifies data analysis by focusing on a smaller, manageable subset.
- Cost-Effective: Reduces costs associated with data collection, storage, and processing.
- Speeds Up Analysis: Enables faster insights and decision-making.
- Enhances Focus: Allows researchers to concentrate on relevant subsets.
- Scalability: Particularly useful for big data scenarios where analyzing the entire dataset is infeasible.
Disadvantages of Data Sampling
- Sampling Bias: Errors in sample selection can lead to biased or inaccurate results.
- Reduced Precision: Smaller sample sizes may not capture the variability of the entire dataset.
- Non-Representativeness: Poor sampling techniques can result in unrepresentative subsets.
- Data Loss: Important information may be missed if the sample doesn’t include outliers or minority groups.
- Difficult Implementation: Choosing the right sampling method and size can be complex and time-consuming.
Comparison of Sampling Methods
| Method | Advantages | Disadvantages |
|---|---|---|
| Random Sampling | Least bias, representative | Can be resource-intensive |
| Systematic Sampling | Simple, evenly distributed | Risk of pattern-related bias |
| Stratified Sampling | Ensures subgroup representation | Complex to implement |
| Cluster Sampling | Cost-effective for large populations | Less accurate due to cluster homogeneity |
| Convenience Sampling | Quick and easy | Highly prone to bias |
| Judgmental Sampling | Focused and expert-driven | Depends on researcher’s subjectivity |
| Snowball Sampling | Useful for hard-to-reach populations | Risk of network-induced bias |
Sample Size Determination
Sample size determination ensures reliable and accurate results by calculating the minimum number of participants needed for a study.
Key Factors
- Population Size: Total number of individuals in the dataset.
- Confidence Level: Probability the sample represents the population (e.g., 95%).
- Margin of Error: Acceptable error range (e.g., ±5%).
- Population Variability: Diversity in the population (higher variability needs a larger sample).
- Effect Size: Expected impact or difference to be detected.
Conclusion
Data sampling is a cornerstone of data analysis and research. Its ability to make analysis practical and cost-effective while retaining accuracy highlights its importance. However, careful attention must be given to the method, sample size, and representativeness to avoid pitfalls like bias or poor generalization. By mastering these principles, data sampling can provide powerful insights into a wide array of applications.
| For AR-VR Notes | Click Here |
| For Big Data Analytics (BDA) Notes | Click Here |
FAQ’s
What is sample size determination?
Sample size determination is the process of calculating the number of participants or observations needed in a study to achieve reliable and statistically significant results.
Why is sample size important?
A properly determined sample size ensures that the results are representative of the population, reduces bias, and provides sufficient power to detect effects or differences.
What factors influence sample size?
Key factors include population size, margin of error, confidence level, population variability, and effect size.
How can I calculate sample size?
Sample size can be calculated using formulas that incorporate the confidence level, margin of error, and estimated population proportion, or by using online calculators and statistical software.
What should I do for small populations?
For small populations, use the adjusted sample size formula to ensure that the sample size remains valid and representative of the entire population.